Viewers
Network graph viewer
The TIDL network viewer utility, tidl_viewer, can be used to view the network graph. If the dot utility is available, tidl_viewer uses it to convert the dot file to svg. dot is included in the Graphviz Ubuntu package and typically installed to /usr/bin/dot.
For example, the following command will generate a dot graph description for the tidl_net_jdetNet_ssd.bin network binary in ssd.dot.
$ tidl_viewer examples/test/testvecs/config/tidl_models/tidl_net_jdetNet_ssd.bin -d ssd.dot
On x86/Linux, if /usr/bin/dot is available, tidl_viewer also generates an svg file, ssd.dot.svg.

Fig. 6 svg file generated by tidl_viewer (click to enlarge)
Note
If dot is not installed in /usr/bin/dot, tidl_viewer will not convert the dot to svg. The following command can be used to generate the svg file as a separate step: dot -Tsvg ssd.dot -o ssd.dot.svg. Additional information on Graphviz and dot available at:
Execution Graph viewer
TIDL API v1.2 enables generation of a log file with timestamps for the following methods in the ExecutionObjectPipeline and ExecutionObject classes:
- ProcessFrameStartAsync (start)
- ProcessFrameStartAsync (end)
- ProcessFrameWait (start)
- ProcessFrameWait (end)
Add the following call to the TIDL API application to enable timestamp generation:
bool EnableTimeStamps(const std::string& file, size_t num_frames);
The generated log file can be viewed on x86/Linux by using the execution_graph.py script located at viewer/execution_graph.py.
-> <install path>/viewer/execution_graph.py timestamp.log
Fig. 7 shows the output of execution_graph.py for the one_eo_per_frame example when run on an AM5749 with 2 EVEs and 2 C66x DSPs:
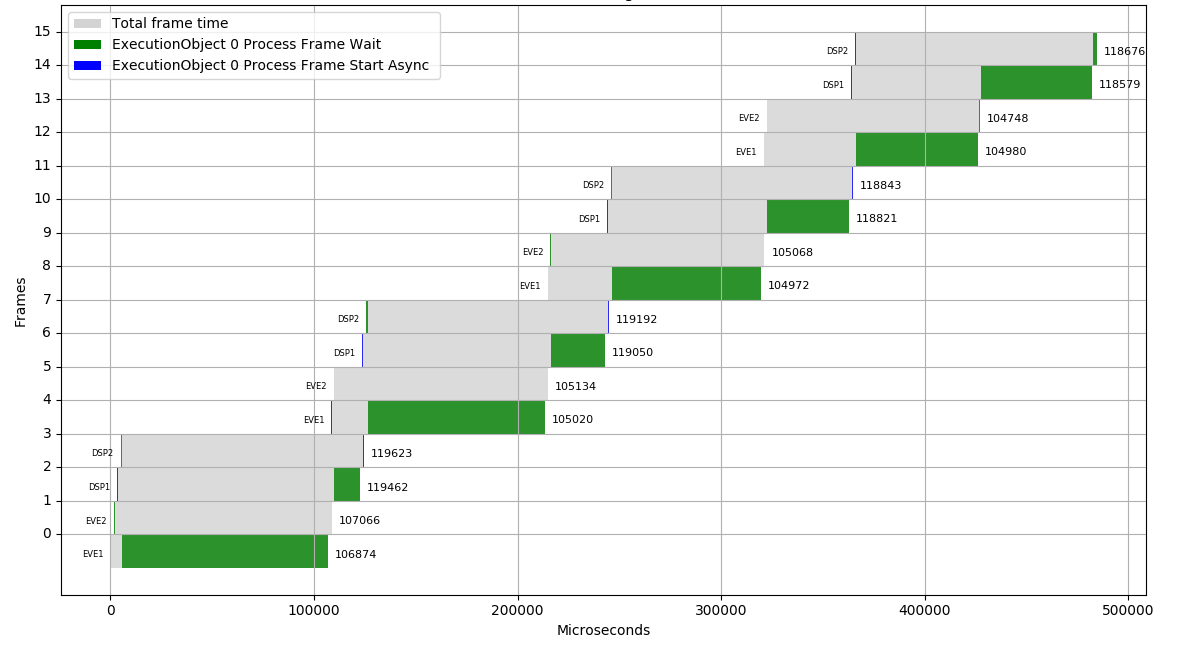
Fig. 7 Graph of frame index vs. execution time generated by execution_graph.py (click to enlarge)
Note
execution_graph.py requires the Python Matplotlib module.